What a Strait of Hormuz toll would actually do to Gulf energy markets — and why the answer is more expensive for everyone than the strike planners likely assumed.
A toll through the Strait of Hormuz was supposed to be Iran’s revenge. It became something more interesting: a lesson in who, exactly, pays for a war after the shooting stops.
Every energy crisis, this series argues, runs a hidden test that sits underneath the noise of price volatility: does the crisis expose flexibility that will, over time, lead to the migration of value, potentially mitigating a future crisis, or does it reveal pseudo-flexibility that only ever exists in the press, and perpetuates the crisis, not moving value at all?
We put that to the test with a narrower and, in the end, more pointed question: what does a Strait of Hormuz toll actually do to the Gulf’s energy markets, and what would Washington pay to make it go away, absorb it quietly, or simply sail around it?
This paper breaks that into five parts. First, the moment, I call it Iran’s eureka moment, when a costly blockade turned into something cheaper and cleverer: a standing, adjustable claim on the world’s most important stretch of water. Second, a reckoning with how much of the world’s oil and gas still runs through the Gulf, because the toll’s bite depends entirely on how few alternatives exist. Third, four tests of what the crisis proved, checked against realistic estimates of the toll’s scale rather than the more excitable rumors. Fourth, the winners hiding inside the losers’ numbers, including a case: India’s opportunistic embrace of discounted Russian crude, that shows the same leverage trick being run on a different stage entirely. Fifth, whether the assumptions that likely justified the strike survived the reality that unfurled. A full timeline sits in the appendix, along with sources, for anyone who wants the history; we use it in the paper without re-litigating it.
Publisher’s Note: on developments since original drafting.
This paper’s closing section characterized the June 18, 2026, Islamabad MOU as having ended the war and opened a diplomatic track to resolve the Strait’s permanent status. That characterization is no longer valid. On July 8, 2026, Iranian forces struck multiple commercial vessels in the Strait without coordinating with Tehran under the MOU’s terms; the US retaliated with strikes on Iranian territory, including near the Bushehr nuclear facility. President Trump declared the MOU “over” and reimposed the oil sanctions it had waived. On July 14, Iran formally withdrew from the MOU. Hostilities, and the underlying dispute over who controls transit through the Strait, are active as of this publication. The Iran–Oman–Gulf littoral dialogue this paper’s watchlist named as the mechanism to watch has not produced an outcome; it has been overtaken by a resumption of the war it was meant to follow. This is not a footnote to the paper’s argument; it is the argument’s own falsifiable test resolving in real time, and the paper is left to stand as a documented account of the ceasefire period, not a forecast of what followed it.
Iran’s Eureka Point
In late February 2026, Iranian and allied forces closed the Strait of Hormuz the hard way: mining lanes, boarding tankers, striking vessels outright. Within a fortnight, traffic had collapsed by more than 94% against the previous year. It was an expensive way to make a point, costly to enforce, costly to Iran’s own trade, costly to a watching world economy, and it taught Tehran something it does not appear to have fully grasped until it saw the demonstration work. The Strait did not need to stay closed to be valuable. It could be reopened, selectively, at a price.
That recognition, that force, once demonstrated, can be converted into a standing economic claim rather than spent as a single act of war, is this paper’s eureka moment. Within roughly two weeks of the initial blockade, Iran’s position had softened from blanket closure into something potentially more useful: a two-tier regime in which vessels linked to the United States and Israel were turned away, and everyone else was screened by the Islamic Revolutionary Guard Corps (IRGC), Iran’s ideological military wing. Within another two or three weeks, that screening had a price tag, reported at roughly $1 a barrel, or $1 million to $2 million per transit for a large tanker, settled in yuan or stablecoins.
A blockade is a price Iran pays once, to make a point. A toll is a price everyone else pays indefinitely, for as long as the threat of reverting to blockade remains credible.
This is the mechanism worth watching, rather more than whatever dollar figure happens to be attached to it this month. A regime that can toggle between force and price commands a sturdier, more adaptable form of leverage than one that can only open or shut a door. What follows tests what that leverage was worth: to Iran, to the buyers on the far side of the Strait, and to Washington, against what happened, not against what was feared.
There is a broader pattern here, and it is the one we track in this series. A chokepoint’s value has always rested on a simple fact: there is no good way around it. Hormuz’s value to whoever controls it is now being tested against precisely that assumption, and the early evidence suggests the assumption is fraying. Every buyer with a genuine alternative, a pipeline that bypasses the Strait, an LNG contract signed with a supplier an ocean away, a seat at the table that gets a cargo waved through on relationship rather than payment, is a data point in value migrating somewhere else. Some of that value is migrating to non-Gulf producers and non-Gulf LNG terminals. Some of it, as the next section sets out, is migrating to whichever buyers can convert a wartime inconvenience into a standing diplomatic arrangement. Chokepoints do not lose their importance all at once. They lose it buyer by buyer, contract by contract, to whoever finds the alternative first.
How Much of the World Actually Runs Through the Gulf?
Any credible reckoning of what a Hormuz toll is worth has to begin with a figure most commentary skips over entirely: how much of the world’s energy production the Gulf still represents today. It matters to ground expectations in the present, rather than in the generation-old assumptions still doing the rounds.
Table 1 shows the share of world oil production controlled by Gulf states.
| Measure | Figure | Trend |
| Gulf states, share of world oil production | ~27%–33% | Roughly stable, slowly declining |
| OPEC+, share of world oil production | 46% (2025–26) | Down from 53% in 2016 |
| Non-OPEC+ growth, 2025–26 | ~1.8 Mbbl/d/yr | Led by US, Canada, Brazil, Guyana, Argentina |
| Crude transiting the Strait of Hormuz | ~20 Mbbl/d | ~20–25% of world seaborne oil |
| Share from five Gulf exporters* | 93.6% | Saudi 37% · Iraq 23% · UAE 13% · Iran 11% · Kuwait 10% |
Table 1. Gulf States Production and Global Share. *Saudi Arabia, Iraq, the United Arab Emirates (UAE), Iran, and Kuwait, as a share of Q1 2025 Hormuz crude and condensate flows. Sources: the US Energy Information Administration (EIA), the International Energy Agency (IEA), Kpler and S&P Global Commodities at Sea vessel-tracking data cited across the reporting used throughout this paper; see the appendix for the full sourced timeline.
The Organization of the Petroleum Exporting Countries and its allied producers (OPEC+) have watched their share of world oil production slide from 53% in 2016 to 46% today, the difference made up almost entirely by supply that never goes near the Strait, chiefly American, with useful contributions from Canada, Brazil, Guyana, and Argentina. A toll imposed on a market where OPEC still held 53% of production would have left importers with markedly less room to maneuver than a toll imposed on today’s (Table 1). Same instrument, slightly smaller teeth. That decline matters for the scenarios below (Figure 1): the toll now extracts less, because the market it is squeezing has more places left to go.
There is a second, sharper version of the same arithmetic, and it concerns Iran specifically rather than the Gulf as a whole. Of the crude that actually transits the Strait, Iran itself accounts for barely 11%, against Saudi Arabia’s 37, Iraq’s 23, the UAE’s 13 and Kuwait’s 10. Iran is tolling a waterway through which the other four Gulf exporters, not Iran, ship the overwhelming majority of the cargo. That is an awkward position from which to run a toll, and it cuts two ways at once.
On one side, a shrinking share strengthens the case, made throughout this paper, that buyers will keep hunting for physical workarounds, bypass pipelines, alternative LNG contracts, anything that avoids a fee levied by a country whose own stake in the traffic is modest and falling, unless Iran can make the toll stick regardless of whether it is the majority shipper.
On the other, it hands Saudi Arabia, Iraq, the UAE and Kuwait a rather large incentive of their own: 83% of the disrupted trade is theirs, none of the disputed toll revenue is, and every week the Strait stays contested is a week in which their customers have more reason to find someone else’s water to sail through. Whether the toll survives may depend less on what Iran can enforce than on what the other four Gulf states are willing to negotiate, with Iran or around it, to protect a trade that is mostly theirs to lose.
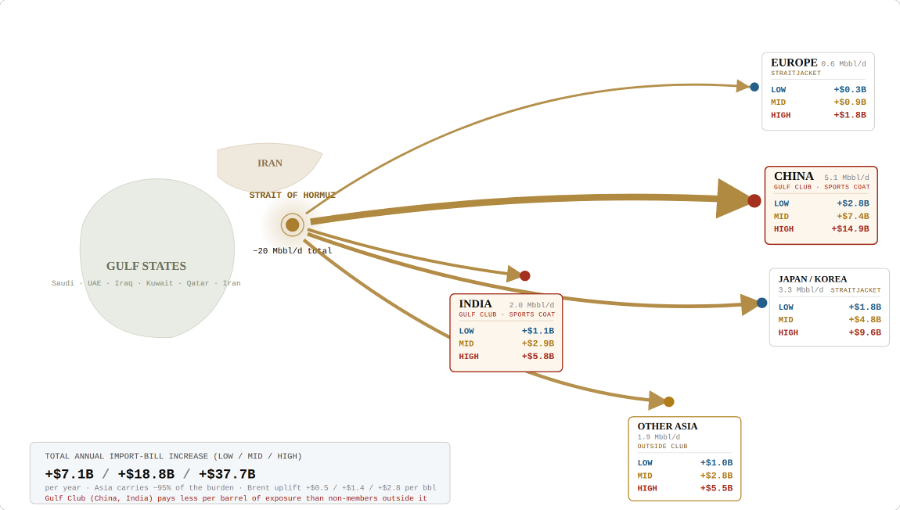
Figure 1. Modeled tolls and modeled impacts. Annual import-bill increase by destination under three tempered toll scenarios, split by “Gulf Club” status. China and India negotiated diplomatically-brokered access; Japan, Korea, and Europe faced the toll with no comparable off-ramp. Author’s model; directional estimates, not forecasts. Click here for an interactive map of tolls impacts.
Four Tests, One Question
Four claims about the crisis seem to be hardening into settled fact, mostly through repetition: that Europe’s dash to American liquefied natural gas (LNG) proves the Strait still has leverage; that electric-vehicle (EV) sales during the price spike prove drivers respond to fuel prices; that refiners simply rerouted around the disruption without breaking stride; and that Iran’s toll behaved like a toll. Each asks the same question this series keeps asking, was the flexibility real, tested and durable, or was it only ever announced, and when checked against the record, each turns out to be true, though for different reasons. The fourth is the one the headlines missed entirely, and it produces the sharpest answer: the toll’s advertised price was a fee, but the thing that moved cargo through the Strait was diplomacy.
Test 1. LNG: real, but the dependency predates Hormuz
Europe’s reliance on American LNG did not begin with Hormuz; it began in 2022, when Russia’s invasion of Ukraine severed pipeline gas and forced the continent’s first, grudging wave of diversification toward American cargoes. Eurostat data show the American share of European Union (EU) LNG imports climbing from 24% in early 2021 to 57.4% by the first quarter of 2026. Hormuz did not create that dependency, but it stress-tested it, disrupting Qatari cargoes at precisely the moment European storage sat at only 30% of capacity after a hard winter. European posture held, then hardened, rather than reverting once the acute danger passed. The Institute for Energy Economics and Financial Analysis (IEEFA) now forecasts the United States could supply 80% of EU LNG imports by 2028, and IEEFA’s own lead European analyst calls that a new vulnerability rather than a diversification success: Europe has swapped one dependency, on Russian pipelines, for another, on American ships. That’s a long-term migration of value.
Test 2. EVs: real, but only for the buyers who had already made the switch
The 2026 conflict produced a genuine, measurable response at the pump: petrol above $4 a gallon in America coincided with double-digit growth in used-EV sales; elevated pump prices spurred British leasing enquiries to rise by more than a third within weeks; German search interest for electric vehicles tripled; global EV sales rose 66% month-on-month in March. The caveat, and it is an important one, concerns the EV buyer. Early EV adoption, well before Hormuz, skewed toward buyers with money to spend on an environmental preference rather than an economic necessity. What the crisis tested was whether that group stuck around once the sentiment faded, the fuel-price argument arrived, and range anxiety was noted. Mostly, they stayed, for the simplest of reasons: an electric vehicle is cheap to run whatever the state of one’s anxiety about range, which is real evidence that the economics were sound underneath the environmental pitch all along, not dependent on it.
It is not yet evidence about the harder case: fleet adoption, where operators such as Amazon and its rivals in delivery and logistics make the call on unit economics alone, with no environmental halo to soften the arithmetic. Fleet behavior, not retail EV sales, is the test that will settle the argument one way or the other.
Test 3. Refiners: real only where the flexibility was already built
Saudi Arabia’s East-West pipeline and the UAE’s Habshan-Fujairah line ran near capacity as bypass routes during the crisis, roughly 7m and 1.8m barrels a day respectively, for the unglamorous reason that the flexibility already existed before the war began. Refiners whose configurations could genuinely handle a substitute crude rerouted around the disruption with barely a dent in their margins. Refiners whose flexibility required a reconfiguration that had not yet happened simply had none. This is the conditional thread running through all four tests: flexibility is real wherever there is substitute capacity that was already built and operating. A claimed flexibility that has not been built or tested is not yet a reality, whatever it becomes later. This is what determines how much of the migration of value proves permanent, and how much is temporary.
Test 4. Fee or Toll: real but diplomacy beats payment
Iran tried to sell its toll to the world as a transaction: pay the fee, join the club, wear the jacket, take the pilot boat, sail through. The record of which cargoes actually moved tells a better story, and its clearest illustration is a pair of sister ships. The Qatari LNG carriers Rasheeda and Al Kharaitiyat are identical in every detail that matters: same Q-Max class, same registry, same operator, same cargo loaded at the same terminal in Ras Laffan. On April 6th Iran’s navy ordered Rasheeda to hold position; she sat in the Gulf for seven weeks while her cargo warmed and her charter obligations piled up. Her sister, Al Kharaitiyat, cleared the Strait on May 10th, not by paying a published fee, but through a government-to-government arrangement between Qatar, Pakistan and Iran, brokered because the cargo was Pakistan-bound and Tehran had an interest in that relationship. By that point only three of thirteen Qatari LNG tankers had cleared the Strait since the war began, each waved through or turned back based on its destination, not its willingness to pay.
Tipping the scale
The scale of actual toll collection confirms the same pattern, only more so. Bridget Diakun, a senior risk and compliance analyst at Lloyd’s List Intelligence, tracked the IRGC’s transit corridor through its opening two weeks and documented “at least two cases of shippers paying Iran for permission to pass” out of 63 vessels that used it, the rest gaining passage through negotiation rather than payment, and more than half of them already part of the sanctions-evading “shadow fleet” for whom this sort of arrangement was old news. An Iranian military spokesman put the logic plainly enough: vessels from countries that comply with American sanctions on Iran would find the crossing difficult (Figure 1). That is not a toll schedule. It is a menu priced in political alignment, on which payment turns out to be only one option, and an unpopular one at that.
The lesson buyers learned was not ‘budget for the fee.’ It was ‘invest in the relationship,’ and a relationship, unlike a fee, cannot be wired the day before a cargo needs to move.
The question this raises is bigger than any single toll payment, and it is the one worth watching over the years, not the weeks, that follow. A clearance system built on relationship rather than price is, by construction, a system that rewards standing membership over occasional custom. If Iran, or a future Gulf administrative body (the Gulf Club), keeps favoring the same buyers on the same terms long enough, diplomatic tolerance hardens into something closer to a trading arrangement: a durable bloc of Iran-friendly or Iran-neutral economies, China and India foremost among the candidates on the present evidence, for whom Gulf energy simply costs less, in cash and in certainty, than it does for everyone else.
That is a materially different outcome from a toll that eventually gets published and paid by all comers. A published toll is a tax. A standing bloc is a reordering, and one that would not obviously run in Washington’s favor, given how much of the alternative supply this paper has already priced (American LNG, non-Gulf crude) depends on buyers choosing the alternative rather than being handed a discount for staying put. Whether that harder outcome is forming, or merely remains a risk worth pricing, is not yet settled by data to hand, which is exactly why it belongs on our watchlist below rather than in the conclusions above it.
What was fake
Announced-but-unbuilt diversification: pipeline capacity that existed only as a promise, and LNG terminals permitted but not yet operating, offered no relief whatsoever when the crisis arrived, for the plain reason that a commitment is not a capability. A project on a press release behaves nothing like a project that is financed, sited and running. Two clear examples arise.
The clearest illustration sits inside Iran’s own infrastructure. Jask, a terminal on the Gulf of Oman fed by the Goreh-Jask pipeline, was built for exactly this contingency: a bypass route letting Iranian crude reach open water without ever touching the Strait it now tolls. Officially inaugurated in 2021, with a reported capacity of 1 million barrels a day, Jask remains, per the International Energy Agency’s own account, effectively non-operational as of early 2026, a pipeline and port built, seemingly, against the day Hormuz became unreliable, sitting unused while Hormuz became unreliable.
The irony is worth sitting with. Jask’s existence suggests Tehran once hedged against a scenario: losing effective control of its own chokepoint.
The other, Saudi Arabia’s East-West Pipeline, the Petroline, offers a mirror case worth watching rather than citing as settled fact. Aramco reported in March 2025 that it had lifted the line’s capacity from a 5-million-barrel-a-day design to 7 million, but the IEA notes that sustained flows at that higher level have not actually been tested. A pipeline that already exists and merely needs to prove it can run harder is a far cheaper problem than one that needs to be built from scratch, which means Petroline’s untested upgrade (not some hypothetical new project) is the nearest thing to a live test of how fast bypass capacity can actually be made real. It belongs on the same watchlist as everything else in this paper: real capacity, once tested, is where the value migrates next.
Scale of the toll
The rumored scale of Iran’s toll revenue: excitable commentary in Tehran floated annual toll revenues of $40–$100 billion. More sober analysis, reported by Iran International, put the realistic figure closer to $1–$2 billion, a number entirely consistent with Diakun’s count of a mere handful of confirmed payments in the corridor’s opening weeks. A steep headline price charged to almost nobody is not a functioning toll system, and the gulf between the announced figure and the tested one is the same real-versus-fake pattern this series keeps turning up, wherever it looks.
What was just a price effect
Brent crude spiked past $120 a barrel in early March and, according to IEA and World Bank tracking, eased back through April and May as the acute phase of the crisis passed. That movement was painful, highly visible, and on its own told us nothing we did not already know. A price spike that fully returns to normal is not evidence that anything changed. It is evidence that markets price disruption efficiently, which was never seriously in doubt.
Too Sexy for the Strait: what a more durable toll could do, modeled, not observed
Everything above happened. What follows did not, or at least not yet. We modelled a few toll scenarios, and kept this firmly separate from the verified record, because the real $1 billion to $2 billion collected in 2026 reflects a toll that was improvised, patchily enforced, and levied against traffic that had already collapsed by more than 94%. A toll that Iran, or some future Gulf administrative body (our Gulf Club) ran deliberately, consistently, and against something closer to full traffic, precisely the outcome the Oman dialogue under Clause 5 could plausibly produce, would extract a good deal more.
The bands below model what we think a more durable version, not the improvised one Iran managed in 2026, might yield.
| Toll scenario | Per-barrel charge | Illustrative annual revenue* | What changes for buyers |
| Low, selectively enforced | $1–$2/bbl | $3–$6B/yr | Absorbed as a cost of doing business by most buyers; minimal rerouting |
| Moderate, consistently enforced | $3–$5/bbl | $9–$15B/yr | Buyers with real non-Gulf alternatives begin exercising them |
| High, cartelized across Gulf states | $6–$10/bbl | $18–$30B/yr | Durable buyer realignment; toll becomes a standing line item in energy contracts |
Table 2. Illustrative, assuming full-traffic throughput of roughly 15–20 Mbbl/d rather than the collapsed 2026 wartime volume; not a forecast of what Iran or a Gulf administrative body will actually charge or collect.
The middle scenario is the one that matters. A low, sporadically enforced toll is a rounding error that most buyers absorb without altering their behavior at all, which is more or less what has happened so far in 2026. A high, fully cartelized toll would likely invite exactly the neutralizing military or diplomatic response that made the outright blockade unsustainable for Iran in the first place; the logic is the same, only the instrument has changed. A moderate, consistently enforced toll is the one durable enough to survive without provoking a forceful response, and large enough to turn non-Gulf sourcing from a hedge into a live commercial decision. In our view, that is the band worth watching for in whatever the Oman dialogue eventually produces.
Winners and Losers Inside the Same Economy
Durable effects should lead to durable migration of value, and the Iran war confounds many observers precisely because it creates winners and losers inside the same economy. A single national exposure figure “Australia is exposed to Hormuz risk” conceals rather more than it reveals, because a toll’s effects do not politely stop at the border. Three cases make the point, the third of them showing the identical leverage trick being run on an entirely different stage.
Australia
Australia imports most of its refined transport fuel from Asian refiners running on Gulf crude, so a Hormuz-driven price shock reached Australian drivers and freight operators directly and without delay. At the same time, Australia happens to be one of the world’s largest LNG exporters, and the very disruption that lifted the Asian LNG benchmark handed its producers a windfall on cargoes that never went anywhere near the Strait. Consumer pain and producer gain, courtesy of the same event, inside the same country. That is how value migrates.
Europe
Higher energy costs squeezed European industry and households alike. At the same time, European refiners, traders and commodity houses captured margin from the very volatility that was squeezing everyone else, the continent managed to be simultaneously more exposed to the disruption and rather better placed to profit from it than any single import-dependency figure would suggest.
India and the Russian crude precedent
India’s behavior since 2022 offers the clearest available precedent for how sanctions-adjacent opportunities may be turned into leverage. The pattern repeated itself, more sharply, during the Hormuz crisis. When the EU, the G7 and the United States sanctioned Russian oil exports after the invasion of Ukraine, Moscow began offering Asian buyers steep discounts to keep its barrels moving. India took the discount and took it enthusiastically: Russian crude rose from under 1% of India’s imports before 2022 to roughly 35–36% by the 2024–25 fiscal year, and Indian refiners captured a benefit estimated at approximately $12.2 a barrel in the earliest phase of the discount, according to Carnegie Endowment analysis.
The mechanism is worth understanding precisely, because it explains why the Biden administration tolerated, arguably needed, that buying to continue. The G7 price cap on Russian oil was never designed to keep Russian barrels off the market; an outright embargo risked a global supply shock that would have spiked prices for everyone, not least American consumers. It was designed instead to cap the revenue Russia could realize on each barrel while letting the volume keep flowing. The distinction matters because Russia’s own production economics rest on two rather different cost floors. Cash-basis extraction cost, what it costs Russian firms to haul a barrel out of the ground and pipe it to port, has run at $13–$21 a barrel since the invasion, on Carnegie Endowment’s reading of Rosstat data. Russia’s fiscal breakeven, by contrast, the price needed to fund the state’s extraction taxes, and by extension the war itself, runs considerably higher, put at $32–$44 a barrel by IHS Markit and the Institute of International Finance. Urals crude sold at a discount to Indian and Chinese buyers has traded in a band ($15–$19 below Brent through 2023–24, narrowing to roughly $11–$15 below Brent by 2025) generous enough to leave Russian producers a real cash margin above extraction cost, yet tight enough to squeeze the state’s fiscal take toward, and at times below, its own breakeven. Geopolitical Futures, an online forecasting shop, reported Russian producers “operating at or near zero profit” on a fiscal basis by December 2025, with Moscow’s daily fossil-fuel revenue at its lowest ebb since the invasion began.
The squeeze was never aimed at the wellhead. It was aimed at the Kremlin’s treasury: keep the oil moving, so the world is spared a shock, but hold the price close enough to Russia’s own breakeven that the state is left with little to fund the war.
This price cap mechanism was designed to squeeze the Kremlin: India’s discount-buying was not a leak in American policy[1]. It was the specific behavior the policy needed in order to work, since only a buyer willing to take barrels at a steep discount could keep Russian output flowing at a price too thin for Moscow’s fiscal comfort, sparing Washington the unhappy choice between a full embargo (supply shock) and full-price sales to a smaller circle of buyers (a fiscal windfall for the Kremlin).
The Trump administration’s 2025 tariff on India rested on a different, narrower rationale, and it deserves to be stated precisely rather than assumed. The White House’s own fact sheet, accompanying the August 2025 executive order that raised tariffs on India to 50%, did not argue that buying discounted Russian oil for domestic use was itself the offence. Rather, it argued that India was “not only buying massive amounts of Russian Oil,” but “selling it on the Open Market for big profits,” casting the behavior as arbitrage rather than the tolerated, domestically-consumed discount-buying the price-cap regime had been built to accommodate. Whether that specific re-export-for-profit charge holds up is a separate empirical question this paper has not verified. What is notable is that the administration’s public reasoning never engaged with, endorsed or rebutted the fiscal-squeeze logic set out above; it is simply absent from the stated case, which leaned instead on national security and a broader grievance about reciprocal trade.
Carrot or stick?
The tariff did not seem to alter India’s buying, whatever its rationale. By June 2026, with Hormuz-related disruptions having knocked out roughly 40% of India’s normal Middle Eastern supply, Indian refiners turned to Russia harder than ever: Kpler vessel-tracking data show Russian crude imports reaching a record 2.35–2.6 million barrels a day in June, 46–53% of India’s entire crude basket, at a discount that had briefly inverted into a $13–$15 premium during the acute crisis before settling back to a $2–$5 discount as Chinese demand for the same barrels cooled. Washington’s sanctions waiver on Russian seaborne oil quietly lapsed around June 17th. It was not renewed. Indian refiners carried on buying regardless.
This is the sharper, symmetric version of this paper’s central question. If a punitive tariff regime cannot durably shift a buyer as large as India off discounted Russian crude, even under genuine economic pressure, the live strategic question is not whether to punish the behavior further. It is what it would be worth to incentivize it away instead, and whether the fiscal-squeeze mechanism the prior administration relied upon is even compatible with that goal, since coaxing India away from Russian crude would remove precisely the discount-buying that was constraining Russian state revenue in the first place. Carnegie’s analysis puts the sanctions-driven Brent uplift alone at an estimated $6–$7 billion in additional annual Indian import costs, a figure that gives both sides a real anchor for negotiation, and one considerably smaller than the diplomatic and economic capital Washington has already spent chasing a different outcome by force.
Unintended Consequences
The stated justification for the strike was Iran’s nuclear program. Specifically, intelligence assessments that Tehran was advancing undisclosed weapons capability. Whether that assessment was solid, overstated, or shaped to fit a decision already taken, is a separate question this paper does not attempt to resolve. What this paper can test is narrower and does not depend on resolving that question either way: a strike of this scale, whatever its stated cause, is never undertaken without some working assumption about how the economic fallout will be contained. That calculus runs alongside the declared rationale regardless of whether the rationale itself holds up, and unlike the rationale, it can be checked directly against what happened.
Two assumptions appear load-bearing for that calculus, 1) that oil price shocks would concentrate on Gulf-dependent Asian buyers rather than reach American consumers, 2) that whatever fallout did reach American shores would be short-lived enough to stay politically manageable. Both are testable, and both are the same kind of claim this series has tested throughout: a containment assumption, never priced or verified before the fact.
Regional Containment: didn’t hold.
The toll and blockade mechanism did concentrate its direct effect on Asian buyers, as the sections above document. But the global Brent price effect was never going to observe such tidy borders, oil is a fungible, globally traded commodity, and a Brent spike reaches every pump on Earth within weeks, regardless of who is actually paying Iran’s toll. This isn’t a subtle point. WTI, the benchmark that prices American petrol, tracks Brent closely through tanker arbitrage and refining economics; the two have historically moved together, give or take a modest spread. A planner needs no special expertise to know this, it’s the same logic a senior American ambassador was, by his own account, applying to Russian oil a few years earlier: constrain a price, and the constraint travels through the entire global system, not just the region where the barrels originate. If the assumption conflated “the toll targets non-allied buyers” with “the price effect stays where the toll is collected,” that’s a meaningful analytical error. The mechanism was regional. The price was not.
Short-lived and politically manageable: didn’t hold.
The acute blockade phase did ease by April and May, but the wider consequences ran longer and reached further into domestic politics than “short-lived” suggests. Federal Reserve researchers modeled a multi-month inflationary path rather than a single spike; the Fed turned cautious on rate cuts specifically because of the war’s price effects; by July, five months after the first strikes, a ceasefire breakdown sent petrol prices climbing again, not the profile of a shock the economy simply absorbed and moved past. The domestic data is sharper still: American petrol hit a record national average of $4.45 entering the 2026 driving season, up roughly 35% since the war began, costing the average household about $38 a month more at the pump. Pew found 69% of Americans specifically concerned about gas prices; University of Michigan consumer sentiment hit an all-time low; and Brookings quantified the exposure geographically, higher-mileage districts absorb a disproportionately larger share of the cost, a distributional detail with real electoral salience on its own terms. An assumption that the economic fallout would stay short and politically manageable proved false. That gap, between the calculus used to justify an action and the evidence the action itself produced, is the unintended consequence this paper set out to find.
Whatever the internal expectation had been, the fallout did not stay short, and it did not stay quiet. It became a measured, reported, and politically attributed cost of the war.
Checklist: Framework to Confirm System Change
Applying the same test as paper one, eight things are worth checking against whatever has happened since this was written, as a counterbalance to trusting whatever the headline might have said at the time:
- The outcome of the Iran–Oman–Gulf littoral dialogue on the Strait’s permanent administration: a fee or governance structure in the moderate-toll range modeled above would be the toll thesis realized in durable form.
- Whether Iran’s clearance model stays diplomatic, case-by-case approval based on a cargo’s destination and origin’s political alignment, or converts into a straightforward, published fee schedule any buyer can pay regardless of relationship. The Rasheeda/Al Kharaitiyat pattern suggests the former is more durable leverage for Iran than the latter, which argues against a clean transactional toll ever fully emerging.
- Whether that diplomatic clearance pattern hardens into a Gulf Club bloc, a standing group of Iran-friendly or Iran-neutral buyers who receive routinely favorable terms, or stays an ad hoc, case-by-case courtesy that dissolves once the acute crisis passes. The distinction matters: a bloc is a reordering of who trades energy with whom. A courtesy is a wartime footnote soon forgotten.
- Whether shipping and buyer sourcing patterns fully revert once any free-passage window closed, or whether rerouted buyers stayed rerouted.
- Whether non-OPEC market share (US, Canada, Brazil, Guyana, Argentina) kept growing after Gulf supply normalized, rather than reverting to the pre-conflict trend.
- Whether India’s Russian-crude share settles back toward its pre-2026 level once Gulf supply normalizes, or whether the 46–53% share becomes the new durable baseline, and whether the US ever offers an economic incentive rather than a further punitive one.
- Whether long-term LNG contracts signed during the conflict persisted on the books, rather than being quietly unwound once prices eased.
- Whether EV sales and, more importantly, fleet-operator adoption remained above the pre-conflict trend twelve to twenty-four months out, measured against the trend line, not the peak.
Each of these is falsifiable within a reasonable timeframe, and that is deliberate. It provides a testable framework to measure value migration. A framework that cannot be checked against what happens is not a strategic tool, it is just an opinion, perhaps with better sourcing.
Appendix: The Sequence
A chronological reference for the events discussed throughout this paper, provided for verification rather than as an argument in its own right:
- Feb 28, 2026: coordinated US and Israeli strikes hit Iran’s nuclear program and its senior leadership, including Supreme Leader Ali Khamenei.
- Feb 28 – early March: Iran and allied forces, including Houthi elements, attack tankers directly in and around the Strait: mining, boarding, drone strikes.
- March 2–4: Iran formally declares the Strait closed. Brent crosses $120/bbl; QatarEnergy declares force majeure on LNG exports. Strait traffic falls more than 94% against the prior year.
- Mid-March: Iran’s position shifts from blanket closure to a two-tier access policy: passage denied to US/Israel-linked vessels, available to others under IRGC screening.
- Late March – April: the access policy becomes a quantifiable toll: roughly $1/bbl or $1–2 million per transit, payable in yuan or stablecoins, administered through a five-tier flag-state classification system.
- April 8: first ceasefire and partial reopening. April 13–May 29: the US Navy blockades Iranian ports in parallel. April 17: Iran declares the Strait open for the duration of a separate ceasefire, with conditions. April 18: within 24 hours, restricted access resumes.
- June 18: the Islamabad Memorandum of Understanding (MOU) ends the war. Clause 5 grants 60 days of free passage, and separately, opens an unresolved, undated Iran–Oman–Gulf-littoral dialogue on the Strait’s permanent “administration and maritime services.”
- July 2026: the ceasefire shows signs of strain; gasoline and oil prices climb again amid renewed uncertainty, five months after the initial strikes.
· Timeline Addendum
- July 7: Strait traffic peaks at 49 ship transits in a single day, the highest since the MOU took effect, as shipping cautiously tests the reopened corridor.
- July 8: Iranian forces strike multiple commercial vessels transiting the Strait without prior coordination with Tehran, the arrangement Iran maintains the MOU requires. The US retaliates with strikes on Iranian territory, including a strike near the Bushehr nuclear power plant. President Trump declares the MOU “over” at the NATO summit and reimposes sanctions on Iranian oil sales that the MOU had waived.
- July 9: The US conducts a second, larger round of strikes on Iranian targets. Iran claims to have struck roughly 85 US military sites across the region, including the Fifth Fleet headquarters in Bahrain and Ali Al Salem Air Base in Kuwait, and states 8 were destroyed.
- July 13–15: CENTCOM continues strikes on Iranian territory, describing the goal as degrading Iran’s ability to threaten shipping in the Strait; targets reportedly include a disabled, unladen tanker en route to an Iranian port. Iranian officials state the Strait “will never reopen through US attacks, war or evil.”
- July 14: Iran formally withdraws from the Islamabad MOU. Strait transits fall to roughly 57 over a weekend, more than 50% below the prior week and back near pre-MOU levels, per MarineTraffic data.
- As of July 16: Brent trades near $85.92/bbl (a one-month high, up ~19% from pre-war levels but well below the ~$120–129 March 2026 peak); WTI trades above $80/bbl. The core dispute remains unresolved: Iran reads the MOU as requiring Iranian coordination for all Strait transit; the US reads “open” as meaning free transit without that coordination.
Clause 5 of the Islamabad MOU is the operative legal text on the Strait’s future, and it does two structurally different jobs at once: a dated, self-expiring 60-day free-passage window (a ceasefire mechanic, not a resolution) and a separate, undated commitment to negotiate the Strait’s permanent administration with Oman and other Gulf littoral states, running on a clock entirely independent of the rest of the MOU. Whatever that negotiation eventually produces, the free-passage clause was always going to be a price event, and the Oman dialogue was always the place where a genuine, durable change (the moderate-toll scenario modeled above, or something else entirely) would be written down. It appears this MOU is dissolving.